
1 min read
Meta-analysis is a subset of systematic reviews that combines pertinent qualitative and quantitative study data from several selected studies to develop a single conclusion with greater statistical power. This conclusion is statistically more significant than the analysis of any single research due to the increased numbers of subjects, greater diversity among subjects, or accumulated effects and results.
More about meta-analysis has been detailed below:
Purpose
- To establish statistical significance with studies that have conflicting results.
- To develop a correct estimate of the effect magnitude.
- To provide a more complex analysis of harms, safety data, and benefits.
- To examine subgroups with individual numbers that are not statistically significant.
Advantages
- Improved precision in convincing evidence about intervention effects when the studies are too small.
- Greater statistical power and confirmatory data analysis.
- Answer the unanswered or unmentioned questions in the research study.
- A good source to respond to conflicted studies for generating new hypotheses.
- Considered an evidence-based resource.
Disadvantages
- Difficult and time-consuming to identify appropriate studies.
- Not all studies provide adequate data for inclusion and analysis.
- Requires advanced statistical techniques.
- Heterogeneity of study populations.
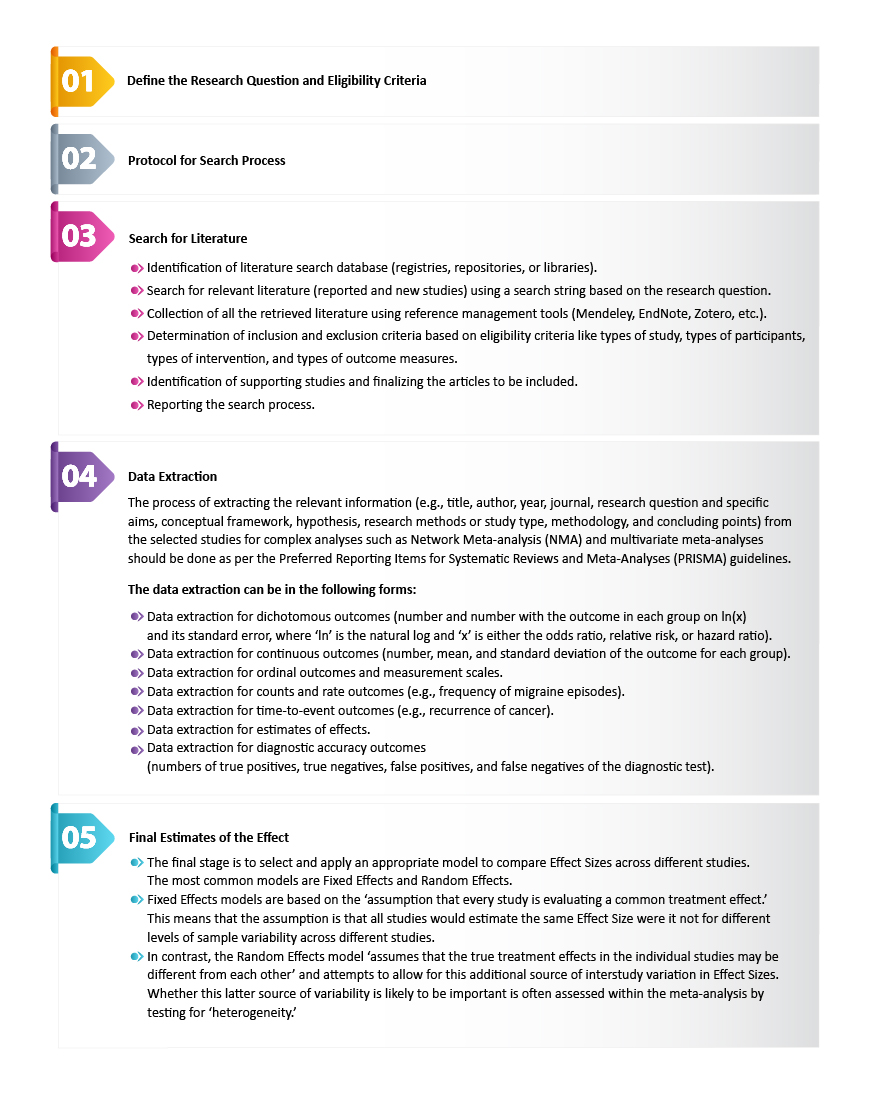
The Five-step Process
Forest Plot
The final estimates from a meta-analysis are often graphically illustrated in the form of a ‘Forest plot.’
A forest plot displays effect estimates and confidence intervals for both individual studies and meta-analyses. In a forest plot, each study is represented by a block at the point estimate of the intervention effect with a horizontal line extending on either side of the block. The area of the block indicates the weight assigned to that study in the meta-analysis, while the horizontal line depicts the confidence interval (usually with a 95% confidence level). The area of the block and the confidence interval convey similar information, but both make different contributions to the graphic. The confidence interval depicts the range of intervention effects compatible with the study’s result. The size of the block draws the eye towards the studies with larger weights (usually those with narrower confidence intervals), which dominate the calculation of the summary result presented as a diamond at the bottom.
Identifying the relevant study data to develop a single conclusion can be a daunting task. Reach out to a proven expert like Freyr for clinical trial study data monitoring and analysis.